
Making PyPI's test suite 81% faster
Trail of Bits has collaborated with PyPI for several years to add features and improve security defaults across the Python packaging ecosystem.
Our previous posts have focused on features like digital attestations and Trusted Publishing, but today we’ll look at a equally critical aspect of holistic software security: test suite performance.
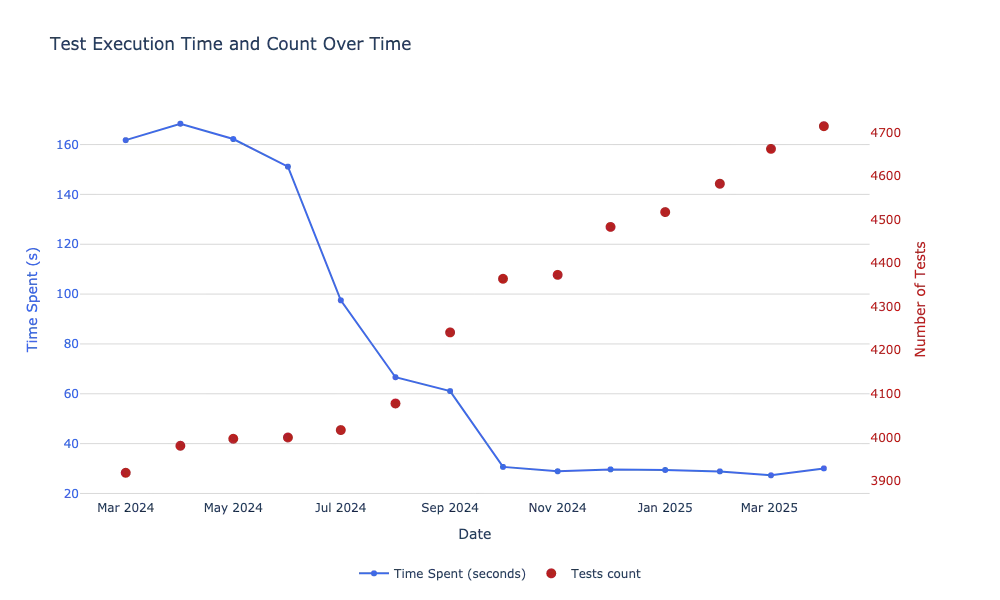
A robust testing suite is essential to the security and reliability of a complex codebase. However, as test coverage grows, so does execution time, creating friction in the development process and disincentivizing frequent and meaningful (i.e., deep) testing. In this post, we’ll detail how we methodically optimized the test suite for Warehouse (the back end that powers PyPI), reducing execution time from 163 seconds to 30 seconds while the test count grew from 3,900 to over 4,700.
We achieved a 81% performance improvement through several steps:
- Parallelizing test execution with
pytest-xdist(67% relative reduction) - Using Python 3.12’s
sys.monitoringfor more efficient coverage instrumentation (53% relative reduction) - Optimizing test discovery with strategic testpaths configuration
- Eliminating unnecessary imports that added startup overhead
These optimizations are directly applicable to many Python projects, particularly those with growing test suites that have become a bottleneck in development workflows. By implementing even a subset of these techniques, you can dramatically improve your own test performance without any costs.
All times reported in this blog post are from running the Warehouse test suite at the specified date, on a n2-highcpu-32 machine. While not intended as formal benchmarking results, these measurements provide clear evidence of the impact of our optimizations.
The beast: Warehouse’s testing suite
PyPI is a critical component of the Python ecosystem: it serves over one billion distribution downloads per day, and developers worldwide depend on its reliability and integrity for the software artifacts that they integrate into their stacks.
This criticality makes comprehensive testing non-negotiable, and Warehouse
correspondingly demonstrates exemplary testing practices: 4,734 tests (as of
April 2025) provide 100% branch coverage across the combination of unit and
integration suites. These tests are implemented using the pytest framework and
run on every pull request and merge as part of a robust CI/CD pipeline, which
additionally enforces 100% coverage as an acceptance requirement. On our
benchmark system, the current suite execution time is approximately 30 seconds.
This performance represents a dramatic improvement from March 2024, when the test suite:
- Contained approximately 3,900 tests (17.5% fewer tests)
- Required 161 seconds to execute (5.4× longer)
- Created significant friction in the development workflow
Below, we’ll explore the systematic approach we took to achieve these improvements, starting with the highest-impact changes and working through to the finer optimizations that collectively transformed the testing experience for PyPI contributors.
Parallelizing test execution for massive gains
The most significant performance improvement came from a foundational computing principle: parallelization. Tests are frequently well-suited for parallel execution because well-designed test cases are isolated and have no side effects or globally observable behavior. Warehouse’s unit and integration tests were already well-isolated, making parallelization an obvious first target for our optimization efforts.
We implemented parallel test execution using pytest-xdist, a popular plugin
that distributes tests across multiple CPU cores.
pytest-xdist configuration is straightforward: this single line change is enough!
# In pyproject.toml
[tool.pytest.ini_options]
addopts = [
 "--disable-socket",
 "--allow-hosts=localhost,::1,notdatadog,stripe",
 "--durations=20",
+  "--numprocesses=auto",
]
With this simple configuration, pytest automatically uses all available CPU
cores. On our 32-core test machine, this immediately yielded dramatic
improvements while also revealing several challenges that required careful
solutions.
Challenge: database fixtures
Each test worker needed its isolated database instance to prevent cross-test contamination.
@pytest.fixture(scope="session")
- def database(request):
+ def database(request, worker_id):
 config = get_config(request)
 pg_host = config.get("host")
 pg_port = config.get("port") or os.environ.get("PGPORT", 5432)
 pg_user = config.get("user")
-   pg_db = f"tests"
+   pg_db = f"tests-{worker_id}"
 pg_version = config.get("version", 16.1)

 janitor = DatabaseJanitor(
This change made each worker use its own database instance, preventing any cross-contamination between different workers.
Challenge: coverage reporting
Test parallelization broke our coverage reporting since each worker process collected coverage data independently. Fortunately, this issue was covered in the coverage documentation. We solved the issue by adding a sitecustomize.py file.
try:
    import coverage
    coverage.process_startup()
except ImportError:
passChallenge: test output readability
Parallel execution produced interleaved, difficult-to-read output. We integrated pytest-sugar to provide cleaner, more organized test results (PR #16245).
Results
These changes were merged in PR #16206 and produced remarkable results:
| Before | After | Improvement | |
|---|---|---|---|
| Test execution time | 191s | 63s | 67% reduction |
This single optimization delivered most of our performance gains while requiring relatively few code changes, demonstrating the importance of addressing architectural bottlenecks before fine-tuning individual components.
Optimizing coverage with Python 3.12’s sys.monitoring
Coverage 7.7.0+ Notice: When using branch coverage with Python versions
prior to 3.14, the COVERAGE_CORE=sysmon setting is automatically disabled and
a warning is emitted.
Our analysis identified code coverage instrumentation as another significant performance bottleneck. Coverage measurement is essential for testing quality, but traditional implementation methods add considerable overhead to test execution.
PEP 669 introduced sys.monitoring, a
lighter-weight way to monitor the execution. The coverage.py library began
supporting this new API in version 7.4.0:
In Python 3.12 and above, you can try an experimental core based on the new
sys.monitoring moduleby defining aCOVERAGE_CORE=sysmonenvironment variable. This should be faster, though plugins and dynamic contexts are not yet supported with it. (source)
Changes in Warehouse
# In Makefile
-  docker compose run --rm --env COVERAGE=$(COVERAGE) tests bin/tests --postgresql-host db $(T) $(TESTARGS)
+ docker compose run --rm --env COVERAGE=$(COVERAGE) --env COVERAGE_CORE=$(COVERAGE_CORE) tests bin/tests --postgresql-host db $(T) $(TESTARGS)
Using this new coverage feature was straightforward, thanks to
Ned Batchelder’s excellent documentation and hard work!
Change impact
This change was merged in PR #16621 and the results were also remarkable:
| Before | After | Improvement | |
|---|---|---|---|
| Test execution time | 58s | 27s | 53% reduction |
This optimization highlights another advantage of Warehouse’s development
process: by adopting new Python versions (in this case, 3.12) relatively
quickly, Warehouse was able to leverage sys.monitoring and benefit
directly from the performance improvements it lends to coverage.
Accelerating pytest’s test discovery phase
Understanding test collection overhead
In large projects, pytest’s test discovery process can become surprisingly expensive:
- Pytest recursively scans directories for test files
- It imports each file to discover test functions and classes
- It collects test metadata and applies filtering
- Only then can actual test execution begin
For PyPI’s 4,700+ tests, this discovery process alone consumed over 6 seconds—10% of our total test execution time after parallelization.
Strategic optimization with testpaths
Warehouse tests are all located in a single directory structure, making them
ideal candidates for a powerful pytest configuration option: testpaths.
This simple one-line change instructs pytest to look for tests only in the
specified directory, eliminating wasted effort scanning irrelevant paths:
[tool.pytest.ini_options]
...
testpaths = ["tests/"]
...$ docker compose run --rm tests pytest --postgresql-host db --collect-only
# Before optimization:
# 3,900+ tests collected in 7.84s
# After optimization:
# 3,900+ tests collected in 2.60sThis represents a 66% reduction in collection time.
Impact analysis
This change, merged in PR #16523, reduced the the total test time from 50 seconds to 48 seconds—not bad for a single configuration line change.
While a 2-second improvement might seem modest compared to our parallelization gains, it’s important to consider:
- Cost-to-benefit ratio: This change required only a single line of configuration.
- Proportional impact: Collection represented 10% of our remaining test time.
- Cumulative effect: Every optimization compounds to create the overall improvement.
This optimization applies to many Python projects. For maximum benefit, examine
your project structure and ensure testpaths points precisely to your test
directories without including unnecessary paths.
Removing unnecessary import overhead
After implementing the previous optimizations, we turned to profiling import times
using Python’s -X importtime option. We were interested in how much time is
spent importing modules not used during the tests. Our analysis revealed that
the test suite spent significant time importing ddtrace, a module used
extensively in production but not during the tests.
# Before uninstall ddtrace
> time pytest --help
real    0m4.975s
user    0m4.451s
sys     0m0.515s

# After uninstall ddtrace
> time pytest --help
real    0m3.787s
user    0m3.435s
sys 0m0.346s| Before | After | Improvement | |
|---|---|---|---|
| Test execution time | 29s | 28s | 3.4% reduction |
This simple change was merged in PR #17232, reducing our test execution time from 29 seconds to 28 seconds—a modest but meaningful 3.4% improvement. The key insight here is to identify dependencies that provide no value during testing but incur significant startup costs.
The database migration squashing experiment
As part of our systematic performance investigation, we analyzed the database initialization phase to identify potential optimizations.
Quantifying migration overhead
Warehouse uses Alembic to manage database migrations, with over 400 migrations accumulated since 2015. During test initialization, each parallel test worker must execute these migrations to establish a clean test database.
import time
import pathlib
import uuid

start = time.time()
alembic.command.upgrade(cfg.alembic_config(), "head")

end = time.time() - start
pathlib.Path(f"/tmp/migration-{uuid.uuid4()}").write_text(f"{end=}\n")Migrations take about 1s per worker, so that’s something we could further improve.
Prototyping a solution
While Alembic doesn’t officially support migration squashing, we developed a proof-of-concept based on community feedback. Our approach:
- Created a squashed migration representing the current schema state.
- Implemented environment detection to choose between paths:
- Tests would use the single squashed migration
- Production would continue using the full migration history
Our proof of concept further reduced test execution times by 13%.
Deciding not to merge
After careful review, the project maintainers decided against merging this change. The added complexity of managing squashed migrations and a second migration path outweighed the time benefits.
This exploration illustrates a crucial principle of performance engineering: not all optimizations that improve metrics should be implemented. A holistic evaluation must also consider long-term maintenance costs. Sometimes, accepting a performance overhead is the right architectural decision for the long-term health of the project.
Test performance as a security practice
Optimizing test performance is not merely a developer convenience—it’s part of a security mindset. Faster tests tighten feedback loops, encourage more frequent testing, and enable developers to catch issues before they reach production. Faster test time is a also a part of the security posture.
All the improvements described in this post were achieved without modifying test logic or reducing coverage—a testament to how much performance can be gained without security trade-offs.
Quick wins to accelerate your test suite
If you are looking to apply these techniques to your own test suites, here are some advices on how to prioritize your optimization efforts for maximum impact.
- Parallelize your test suite: install
pytext-xdistand add--numprocesses=autoto yourpytestconfiguration. - Optimize coverage instrumentation: if you’re on Python 3.12+, set
export COVERAGE_CORE=sysmonto use the lighter-weight monitoring API incoverage.py 7.4.0and newer. - Speed up test discovery: Use
testpathsin yourpytestconfiguration to focus test collection on only relevant directories and reduce collection times. - Eliminate unnecessary imports: use
python -X importtimeto identify slow-loading modules and remove them where possible.
With a couple of highly targeted changes, you can achieve significant improvements in your own test suites while maintaining their effectiveness as a quality assurance tool.
Security loves speed
Fast tests enable developers to do the right thing. When your tests run in seconds rather than minutes, security practices like testing every change and running the entire suite before merging become realistic expectations rather than aspirational guidelines. Your test suite is a frontline defense, but only if it actually runs. Make it fast enough that no one thinks twice about running it.
Acknowledgments
Warehouse is a community project, and we weren’t the only ones improving its
test suite. For instance, PR #16295 and PR #16384 by @twm also improved
performance by turning off file synchronization for postgres and caching DNS
requests.
This work would not have been possible without the broader community of open source developers who maintain PyPI and the libraries that power it. In particular, we would like to thank @miketheman for motivating and reviewing this work, as well as for his own relentless improvements to Warehouse’s developer experience. We also extend our sincere thanks to Alpha-Omega for funding this important work, as well as for funding @miketheman’s own role as PyPI’s Security and Safety Engineer.
Our optimizations also stand on the shoulders of projects like pytest, pytest-xdist,
and coverage.py, whose maintainers have invested countless hours in building robust,
performant foundations.