
Benchmarking OpenSearch and Elasticsearch
This post concludes a four-month performance study of OpenSearch and Elasticsearch search engines across realistic scenarios using OpenSearch Benchmark (OSB). Our full report includes the detailed findings and comparison results of several versions of these two applications. We have not modified either codebase.
Organizations running search-driven applications—from product searches on e-commerce sites to real-time market analysis at financial institutions—depend heavily on search engine performance. OpenSearch and Elasticsearch enable fast, scalable, and efficient data retrieval, making them essential for applications like website search, time-series log analysis, business intelligence, and cybersecurity monitoring. Both are increasingly used in generative AI, machine learning, and vector applications as well.
When milliseconds of latency can impact user experience or business operations, even small performance differences can have significant costs. Amazon Web Services (AWS) requested that we conduct an independent benchmark assessment comparing these two prominent search-and-analysis software suites.
As a result of our independent assessment, we observed that OpenSearch v2.17.1 is 1.6x faster on the Big5 workload and 11% faster on the Vectorsearch workload than Elasticsearch v8.15.4, when aggregating the geometric mean of their queries. However, benchmarking both applications is a moving target because both OpenSearch and Elasticsearch have frequent product release cycles.
Over the course of our testing, Elasticsearch updated its product to version 8.17.0, and OpenSearch released version 2.18.0. We developed reusable code that automates repeatable testing and analysis for both platforms on AWS cloud infrastructure.
This review compares the query latencies of OpenSearch and Elasticsearch on OpenSearch Benchmark workloads. OSB uses the client-side service time metric (measured in milliseconds) for this purpose; it represents how long a request (i.e., query) takes to receive a response. This includes overhead (network latency, load balancer overhead, serialization/deserialization, etc.). OSB records the 90th percentile (p90) of service times for each operation.
The scope was limited to Apache v2 (OpenSearch) and Elastic 2.0 (Elasticsearch) licensed versions of the two engines and did not include proprietary systems. The results can be used to direct future development of individual components for each engine.
While six OSB workloads were evaluated in our full report, this blog post highlights results from Big5 (a comprehensive workload that performs text querying, sorting, date histogram, range queries, and term aggregation) and Vectorsearch (a workload querying a dataset of 10 million 768-dimension vectors using approximate K-Nearest Neighbor (KNN) search). We compare recent versions of OpenSearch and Elasticsearch—v2.17.1 (released October 16, 2024) and v8.15.4 (released November 12, 2024), respectively.
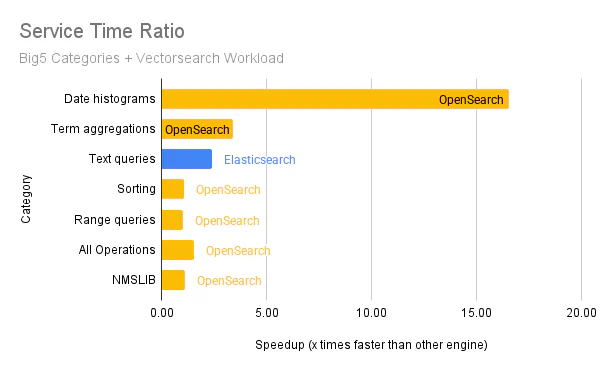
Figure 1 illustrates our results comparing OpenSearch to Elasticsearch on the Big5 and Vectorsearch workloads:
Observations and Impact
Methodology
We executed OpenSearch and Elasticsearch on workloads once per day, every day for 15 days—except Vectorsearch, which we ran for 11 days. We collected between 11 and 15 tests per workload per engine. We set up brand-new AWS instances each time and executed workloads five times in a row. We discarded the first run to ensure that the hardware, operating system, and application caches were warmed up for both engines. Each operation in the workload was executed hundreds to thousands of times. This resulted in thousands to tens of thousands of sample measurements per operation. We believe this is a large enough sample size to draw reliable conclusions.
Results processing and statistical analysis
We observed that some operations (mainly those whose service time values were less than one millisecond) had a statistical power lower than our chosen threshold of 90% despite having a low p-value: this signifies that a statistically significant difference could be detected, but its magnitude could not be observed reliably enough. Therefore, we executed additional runs of those operations to increase their statistical power. After doing so, we confirmed that any statistically significant difference between OpenSearch and Elasticsearch performance characteristics in the tasks noted above was inconsequential. However, users are likely more concerned about the performance of longer-running queries than those that complete within a few milliseconds.
Outliers
We calculated the median of each workload operation’s p90 service time. We did this because we saw non-trivial variations in performance in several runs in both OpenSearch and Elasticsearch. These outliers can impact the arithmetic average. We chose not to statistically exclude these outliers (e.g., using standard deviation or quartiles as the exclusion criteria) because the results do not necessarily follow a Gaussian (normal) distribution. Therefore, we believe the median across this large number of independent data points is most representative of the summary statistics we calculated for OpenSearch and Elasticsearch. For completeness, the full report includes sparklines that visually indicate the degree of variance across queries.
With our methodology established, let’s examine what our extensive testing revealed about the performance characteristics of these search engines.
Big5 workload overview
The Big5 workload comprises a set of carefully crafted queries that exercise all the major capabilities available in OpenSearch and Elasticsearch. They fall into the following categories. For this performance comparison, each query is weighted the same.
Text Queries: Searching for text is fundamental to any search engine or database. Entering natural language queries is intuitive for users and does not require knowledge of the underlying schema, making it ideal for easily searching through unstructured data.
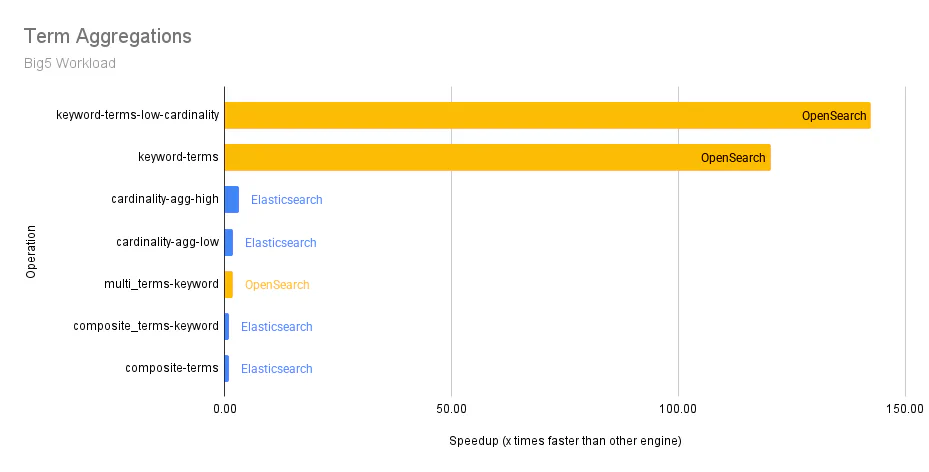
Term Aggregation: This query type groups documents into buckets based on specified aggregation values, which is essential for data analytics use cases.
Sorting: Evaluates arranging data alphabetically, numerically, chronologically, etc. This capability is useful for organizing search results based on specific criteria, ensuring that the most relevant results are presented to users.
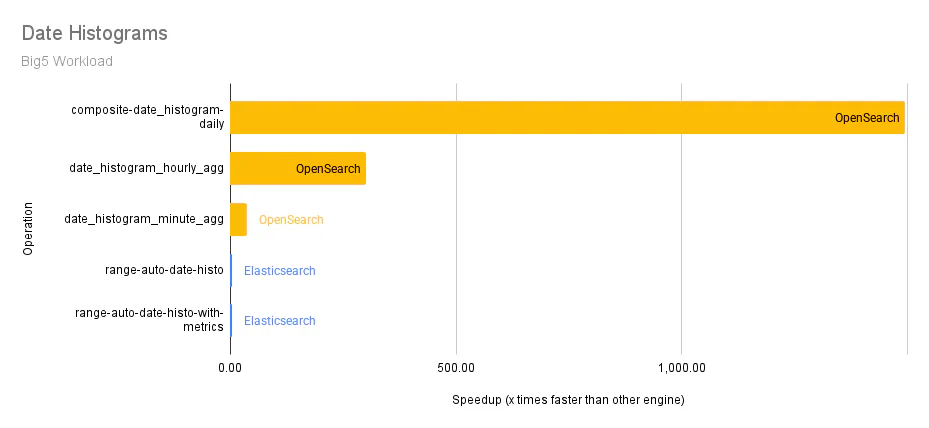
Date Histogram: This is useful for aggregating and analyzing time-based data by dividing it into intervals. It allows users to visualize and better understand trends, patterns, and anomalies over time.
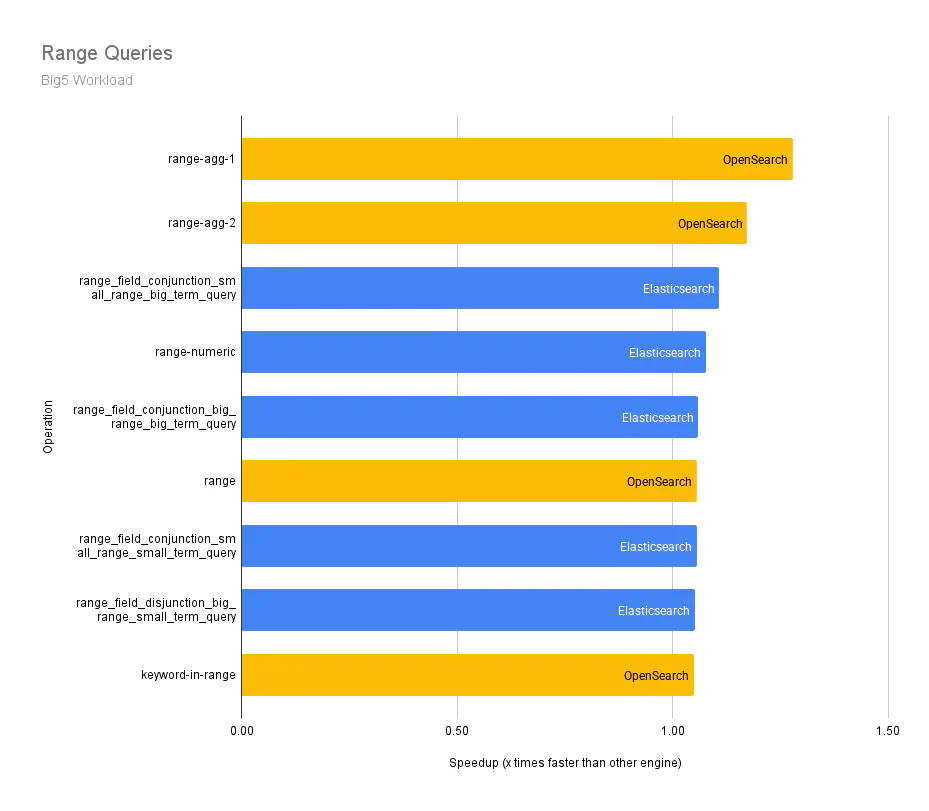
Range Queries: This is useful for filtering search results based on a specific range of values in a given field. This capability lets users quickly narrow their search results and find more relevant information.
Big5 workload category results
Using the geometric mean of the median values of all query operations in the Big5 workload, we observe that OpenSearch v2.17.1 is 1.6x faster than Elasticsearch v8.15.4. Below, we provide more details about how we arrived at this estimate.
First, to ensure that our testing methodology was accurate, we referenced a recent blog post from the OpenSearch project on their performance measurements of v2.17. We compare their reported performance (see the Results section of their post) to ours in the table below. This includes all operations in Big5, while skipping the match_all query (named default in the workload) and the scroll query. This is the same protocol followed in the post.
| Geomean of Operation Category – Median of p90 Service Time (ms) | Our Results (v2.17.1) | OpenSearch Results (v2.17) |
|---|---|---|
| Text queries | 16.09 | 21.88 |
| Sorting | 5.82 | 7.49 |
| Term aggregations | 104.90 | 114.08 |
| Range queries | 1.47 | 3.30 |
| Date histograms | 124.79 | 164.03 |
Table 1: Establishing a baseline for OpenSearch
Note that the OpenSearch project publishes its performance numbers nightly at https://opensearch.org/benchmarks
Since these values are reasonably close (albeit slightly different, most likely due to different version numbers), we compare our results of running OpenSearch v2.17.1 to Elasticsearch v8.15.4.
The original blog post above does not include two Big5 operations: default and scroll. Both use the match_all query, which returns all documents. Below, we add and categorize them as Text queries.
| Geomean of Operation Category – Median of p90 Service Time (ms) | OpenSearch v2.17.1 | Elasticsearch v8.15.4 | OpenSearch is slower/faster than Elasticsearch |
|---|---|---|---|
| Text queries | 18.11 | 7.47 | 2.42x slower |
| Sorting | 5.82 | 6.14 | 1.05x faster |
| Term aggregations | 104.90 | 354.52 | 3.38x faster |
| Range queries | 1.47 | 1.49 | 1.02x faster |
| Date histograms | 124.79 | 2,064.61 | 16.55x faster |
| All Operations | 12.1 | 18.8 | 1.56x faster |
Table 2: Big5 comparison between OpenSearch and Elasticsearch
Next, we assess comprehensive Big5 workload testing results to understand these observations, which exercise core search engine functionality.
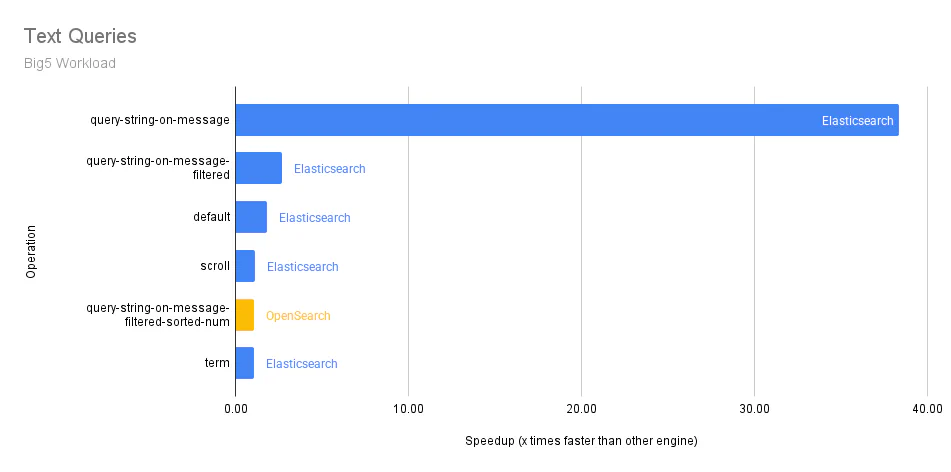
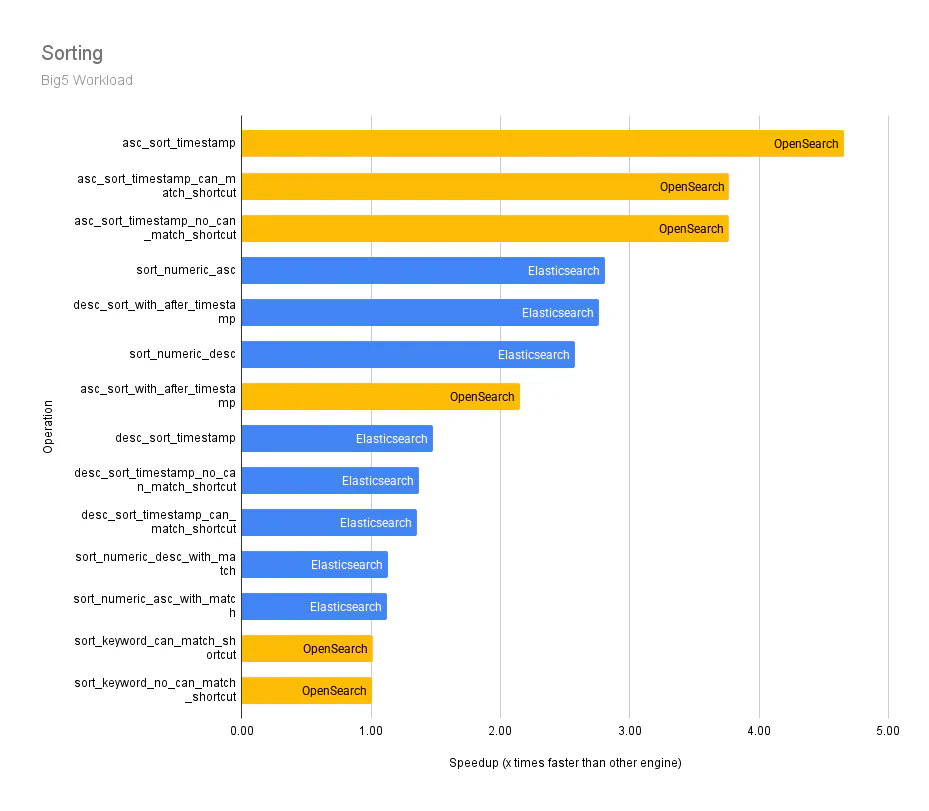
Big5 workload operation results
The following graphs show the differences in median p90 service times across the individual query operations in the Big5 workload for each category. The y-axis represents an operation, and the x-axis represents how many times faster an engine (OpenSearch or Elasticsearch) is over the other.
Vectorsearch Workload Results
Having examined traditional search operations, we now turn to vector search capabilities, an increasingly important feature for modern applications using AI/ML techniques. Here, we discuss the Vectorsearch workload results. Force-merge is enabled by default.
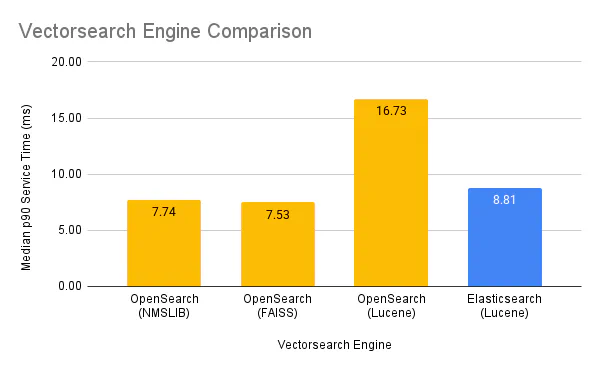
OpenSearch supports three vector search engines: NMSLIB, FAISS, and Lucene. These engines cater to various algorithms (HNSW, HNSW+PQ, IVF, and IVF+PQ) and quantization techniques (fp16, 2x compression to binary, 32x compression) based on different user workloads. The default vector engine for OpenSearch 2.17.1 is NMSLIB. Newer releases after 2.17 have switched to FAISS.
On the other hand, Elasticsearch supports only Lucene. Any reported values in the charts below for Elasticsearch indicate test runs using the Lucene engine. For brevity, we specify a search engine and the vector search engine used in this format: search engine (vector engine).
The Vectorsearch workload consists of one primary query: prod-queries, a vector search of the ingested data with a recall computation for the ANN search.
Similar to Big5, we compare the median p90 service time values. Focusing on an out-of-the-box experience with the respective default configured engines (NMSLIB for OpenSearch and Lucene for Elasticsearch), OpenSearch is 11% faster than Elasticsearch for this metric, with similar recall and the same hyper-parameter values.
Vectorsearch Performance Details
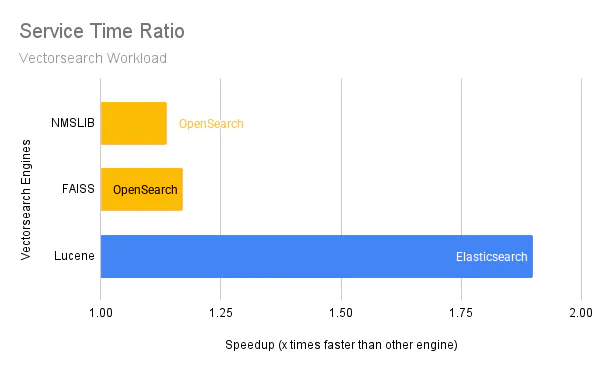
Comparing each OpenSearch v2.17.1 vector engine against Elasticsearch (Lucene) v8.15.4 yielded the following findings:
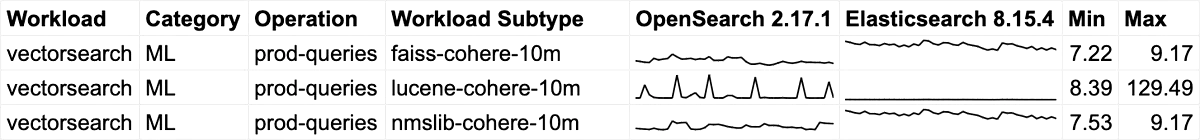
- OpenSearch (NMSLIB) was 11.3% faster.
- OpenSearch (FAISS) was 13.8% faster.
- OpenSearch (Lucene) was 258.2% slower.
The median values are as follows:
Below are sparklines comparing OpenSearch and Elasticsearch on the Vectorsearch workload. The x-axis represents time, and the y-axis represents the p90 service time (in milliseconds). The min and max values represent the minimum and maximum values of the y-axis for each sparkline, respectively. Each pair of sparklines in a row is plotted with the same y-axis. All Elasticsearch sparklines plot the same data, but they appear different from each other due to different y-axis minimum and maximum values.
As shown above, OpenSearch (Lucene) varies in its performance. While this paints a clear picture of relative performance, our testing also revealed some important caveats about consistency that users should consider.
Performance Inconsistencies
We observed slow outlier runs for p90 service times for OpenSearch and Elasticsearch. We investigated these scenarios but could not identify the root cause. For example, note the random spikes in Figure 9 above for OpenSearch (Lucene). While these anomalies did not affect our overall conclusions, they warrant further investigation. We still included outliers in the datasets when calculating results, as there was no systematic way to remove them.
We can quantify how extreme outliers are by the ratio of the maximum service time over the median service time. Using this ratio, we found that OpenSearch has outliers that are more extreme than those of Elasticsearch. The tasks with the most extreme ratios for OpenSearch and Elasticsearch were:
- OpenSearch 2.17.1: 1412x for
composite-date_histogram-daily - Elasticsearch 8.15.4: 43x for
query-string-on-message
We counted how many tasks have outlier runs using the criterion of a run with a value that is more than twice as slow as the median. We found that Elasticsearch has more outliers than OpenSearch:
- OpenSearch 2.17.1: 11 outlier tasks out of 98
- Elasticsearch 8.15.4: 19 outlier tasks out of 98
Repeatable, Open-Sourced Benchmarking
Based on these findings about both performance and consistency, we’ve developed several key recommendations for conducting reliable search engine benchmarks:
Always run workloads on newly created instances. If not, variations in workload performance may not be observed, which would skew a user’s expectations.
After collecting data, measure both the p-value and the statistical power to ensure statistical reliability. Measuring p-values across runs with the same configuration helps detect anomalies where you expect high p-values (> 0.05) when comparing similar runs. Measure against different configurations (like different setups or engines) to confirm that changes produce statistically different results.
Benchmarking should use configurations that closely match the out-of-the-box experience. Sometimes, changes are needed for a fair benchmark. In these cases, document the changes and explain why they aren’t suitable for the default configuration.
A snapshot approach that may create more consistent results is to flush the index, refresh the index, and then wait for merges to complete before taking a snapshot. We found promising initial results in testing this approach with the Vectorsearch workload, but have not extensively tested this strategy.
Looking beyond our specific findings, we wanted to ensure that our work could serve as a foundation for future benchmarking efforts. We focused on creating repeatable and objective performance comparisons between OpenSearch and Elasticsearch and used GitHub Actions to make our experiments easy to reproduce. This enables ongoing performance comparisons in the future.
If you’re interested in how we can support your project, please contact us.